October 15, 2026
TRB Trust & Wealth Management Q3 Review & Market Update
Uncategorized
Fraud Alert: Scammers are texting and calling as TRB’s Fraud Department. TRB’s Fraud Department will never call you, text you a link, or ask for your username, password, or token code verbally or via text. If contacted, hang up and call us at 855-534-4433.


FDIC-Insured – Backed by the full faith and credit of the U.S. Government
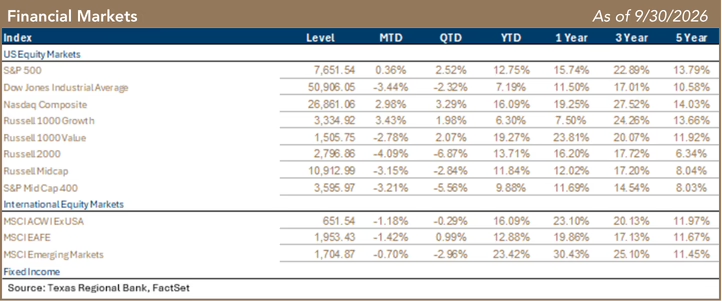
The S&P 500 climbed 2.5% in the third quarter, joined by the Nasdaq Composite with a gain of 3.3%, but trailed by the Dow Jones Industrials, which fell by -2.3%. Small and mid-capitalization indices struggled, with losses of -6.9% from the Russell 2000 Small-Cap index and -2.8% from the Russell Midcap index. Major international indices were weaker, with the MSCI ACWI Ex US Index -0.29% and MSCI Emerging Markets -2.96%. The benchmark 10-year Treasury yield finished the fourth quarter yielding 5.3%, significantly above the 4.2% yield level at which it began the year.
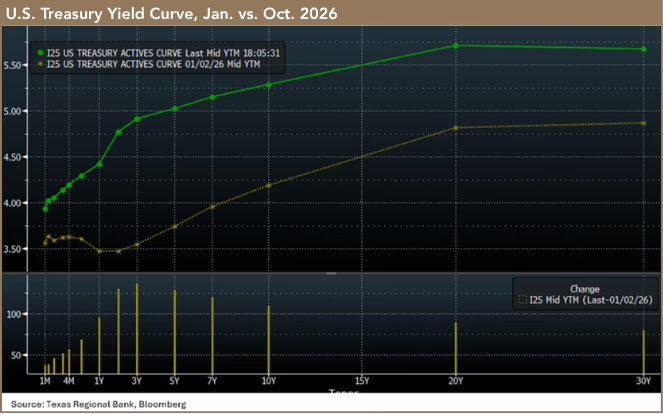
The change in fixed income dynamics over the course of 2026 has been substantial—a year that began with 2-year Treasuries yielding 3.47% and expectations for 50 basis points (bps) of Federal Reserve cuts transitioned to the Fed raising rates in October with at least another 25 bps of further hikes expected and a 2-year yield of 4.8% at the end of the third quarter. Graphically, the yield curve went from inverted and unhealthy to steep and projecting growth at such a rate that the Fed was compelled to provide monetary restraint during an election season; the year’s change creating an entirely different opportunity for fixed income investors and a difficult reality for mortgage and variable rate borrowers. The visual of the year’s evolution in yield expectations is extreme enough to speak for itself.
In this environment, investors in conservative bond ladders open monthly statements and see portfolios with small losses as the trading prices of the underlying bonds adjust to higher interest rates. In most cases, the laddered portfolio is generating the yield level that was expected at the time of investment, alongside ‘paper’ losses that will be eliminated if the investor is patient enough to allow the bond to mature at par value. Laddered bond portfolios are designed to reset into an increasing yield environment, with shorter-term bonds in the ladder maturing regularly, which allows those dollars to be reinvested at higher yields. If you have a well-constructed, intermediate or shorter duration investment-grade bond ladder where the yield is in line with original expectations, recognize that while market prices of the bonds adjust, the interim price changes will typically be eliminated when the bond matures. There is no reason to turn the paper loss into a realized one.
Election season clamor affects markets, with the modern midterm cycle bringing a gut punch of late summer and early fall television advertising aimed at each candidate’s most glaring vulnerabilities, particularly in states that have senate seats in play. Texans have seen our fill of Talarico and Paxton attack ads—typically read in ominous undertones as the television screen cycles through shades of disaster-toned gray. These spots don’t leave viewers feeling good about anything, no matter their political persuasion, and the ultimate electoral result favors whichever party has had the least to do with where things stand for the country between presidential election years.
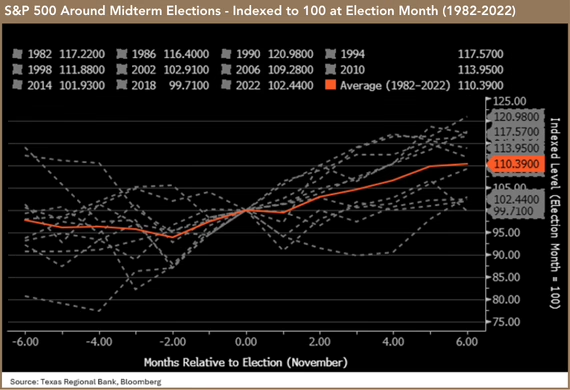
The noise has a consistent impact on market performance around midterm elections. The graphic below shows S&P 500 performance through each midterm election cycle since 1982—from six months prior to Election Day to six months after—as well as the average of those 11 election cycles (orange). It is typical for U.S. equity markets to see weakness in the months leading up to the midterms, with market improvement as the end nears, followed by upward follow-through after the last vote is counted and the country moves on from billions worth of grayscale half-truths.
The S&P 500 gained 12.8% year-to-date through the end of September, following annual growth of +20% in 2023 and 2024, and 16% in 2025—an extraordinary period for U.S. large-cap stocks. It has been an extraordinary run for earnings growth as well, with expectations for S&P 500 EPS growth of 24% in 2026 after 26% annual earnings growth in 2025. We discussed four potential market scenarios at the beginning of 2026, ranging from strong growth to more challenged conditions. The most aggressive scenario we evaluated was 16% EPS growth for the full year, which is, with over two thirds of the year accounted for, slightly lower than the current trajectory. In that scenario, we projected forward the 25.4x year-end S&P 500 earnings multiple for an end of 2026 potential S&P 500 value of 7950, two percent above the S&P 500 level today.
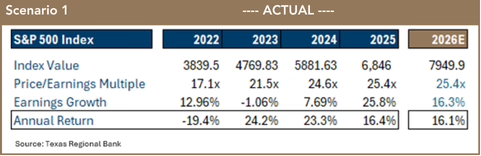
We will revisit this scenario analysis as we move into 2027, but for now will simply point out that the S&P 500 remains very expensive, trading at 22.7x the 2026 earnings estimate. The market will require continued high earnings growth to support that level and valuation.
The S&P 500 fell -4.3% in the first quarter, joined by the Nasdaq and Dow Jones Industrial Average with declines of -7% and -3.2%, respectively…
Read the Q1 ReviewThe narrative in the third quarter focused on interest rates, inflation, and the Federal Reserve, while military conflict with Iran directly impacted all three topics through the daily movement in oil prices. The Trump administration has tried to press the pause button on hostilities to help the Republican chances of holding the U.S. Senate in the midterms, and there are numerous potential scenarios that could play out after the election. The war is a wild-card factor, but the trend in markets following midterms, as well as the possibility of a FOMO (fear-of-missing-out) performance chase through the end of the year both increase the likelihood of a strong equity market finish to 2026, despite high valuations. As we move ahead into 2027, however, the same factors investors have been concerned about—interest rates, inflation, oil prices, and military conflict in an economically impactful region—stand to put the last three years of performance history and the current valuation of domestic equities to a difficult test.
DISCLOSURES:
Form CRS | Form ADV | Advisor Info
Investment and insurance products: NOT FDIC INSURED | MAY LOSE VALUE | NO BANK GUARANTEE
TRB Wealth Management, LLC is a Registered Investment Advisor with the Securities and Exchange Commission
TRB Wealth Management, LLC does business in the name of TRB Trust and Wealth Management. Trust and Family Office services offered exclusively through Texas Regional Bank. The trust department of Texas Regional Bank has engaged TRB Wealth Management, LLC to provide investment advice to Texas Regional Bank for trust department accounts.