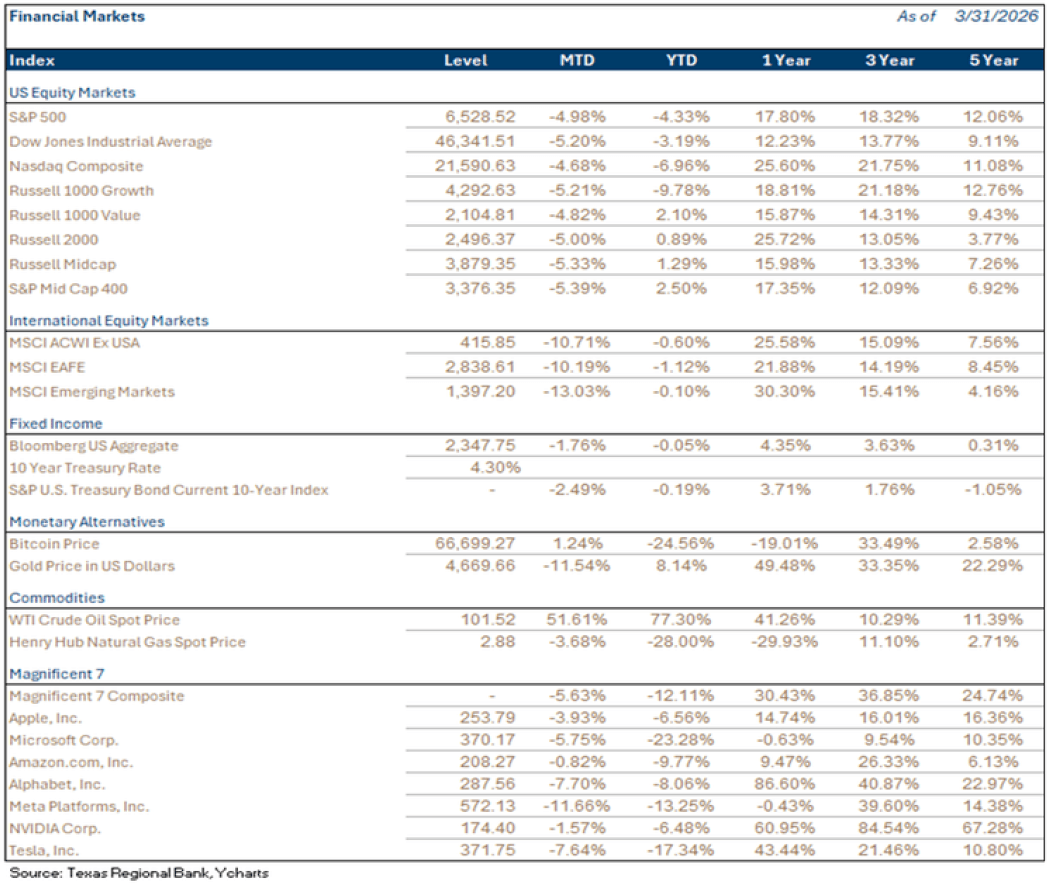
The S&P 500 fell -4.3% in the first quarter, joined by the Nasdaq and Dow Jones Industrial Average with declines of -7% and -3.2%, respectively. Small- and mid-capitalization indices fared better, with gains of +0.9% from the Russell 2000 Small Cap Index and +1.29% from the Russell Midcap Index. Major international indices also lost ground but outperformed the US, with the MSCI EAFE -1.1% and MSCI Emerging Markets -0.1% for 1Q. The benchmark 10-Year Treasury yield finished the fourth quarter at 4.3%, above the 4.19% level at which it began the year.
Bunker Busters, Blockades, and $100 Oil
In March of this year, the Strait of Hormuz escalated from being a potential Jeopardy question for the geographically minded to the catalyst for front-page news as the war in Iran forced emergency due diligence on the most dangerous pinch point in global trade. 20-25% of crude supply has historically floated through the 20-30-mile-wide waterway bordered by Iran to the North and Oman and the UAE to the South in tankers called ‘Very Large Crude Carriers’ (VLCCs). When the first VLCC caught fire, the impact on oil prices was almost immediate, with Brent Crude Oil prices doubling from $60 lows in January to highs near $120 in March.
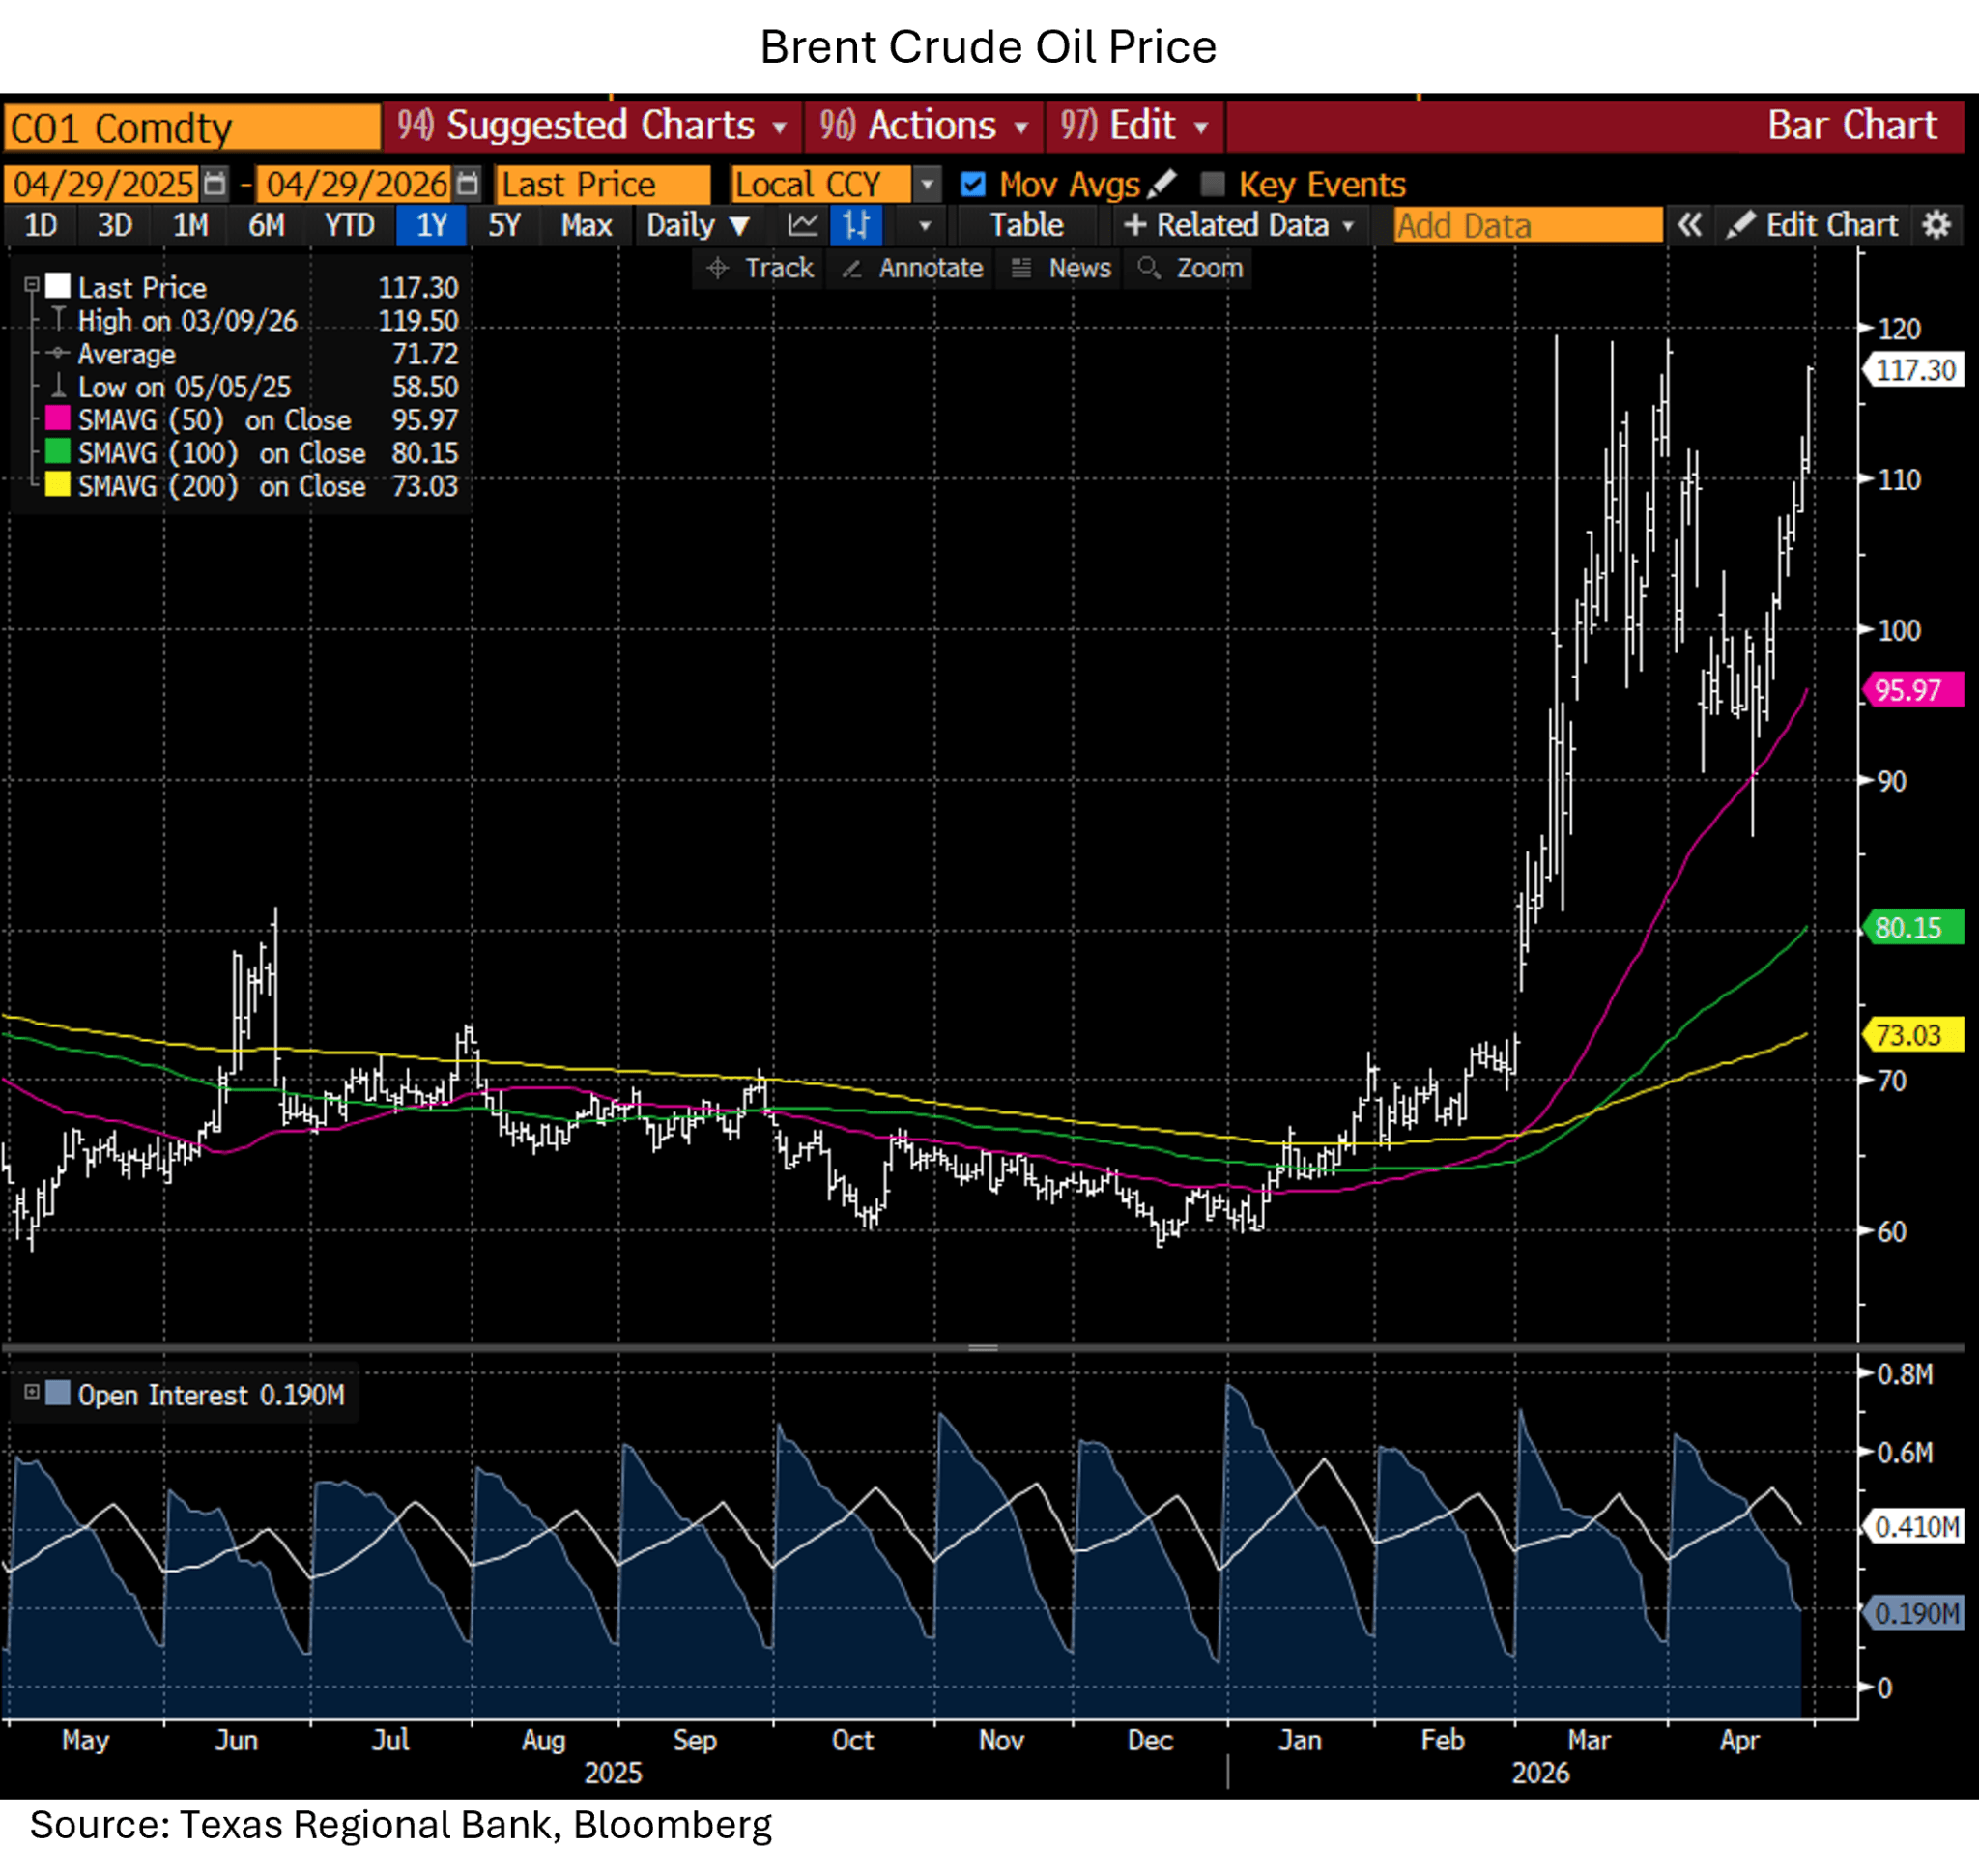
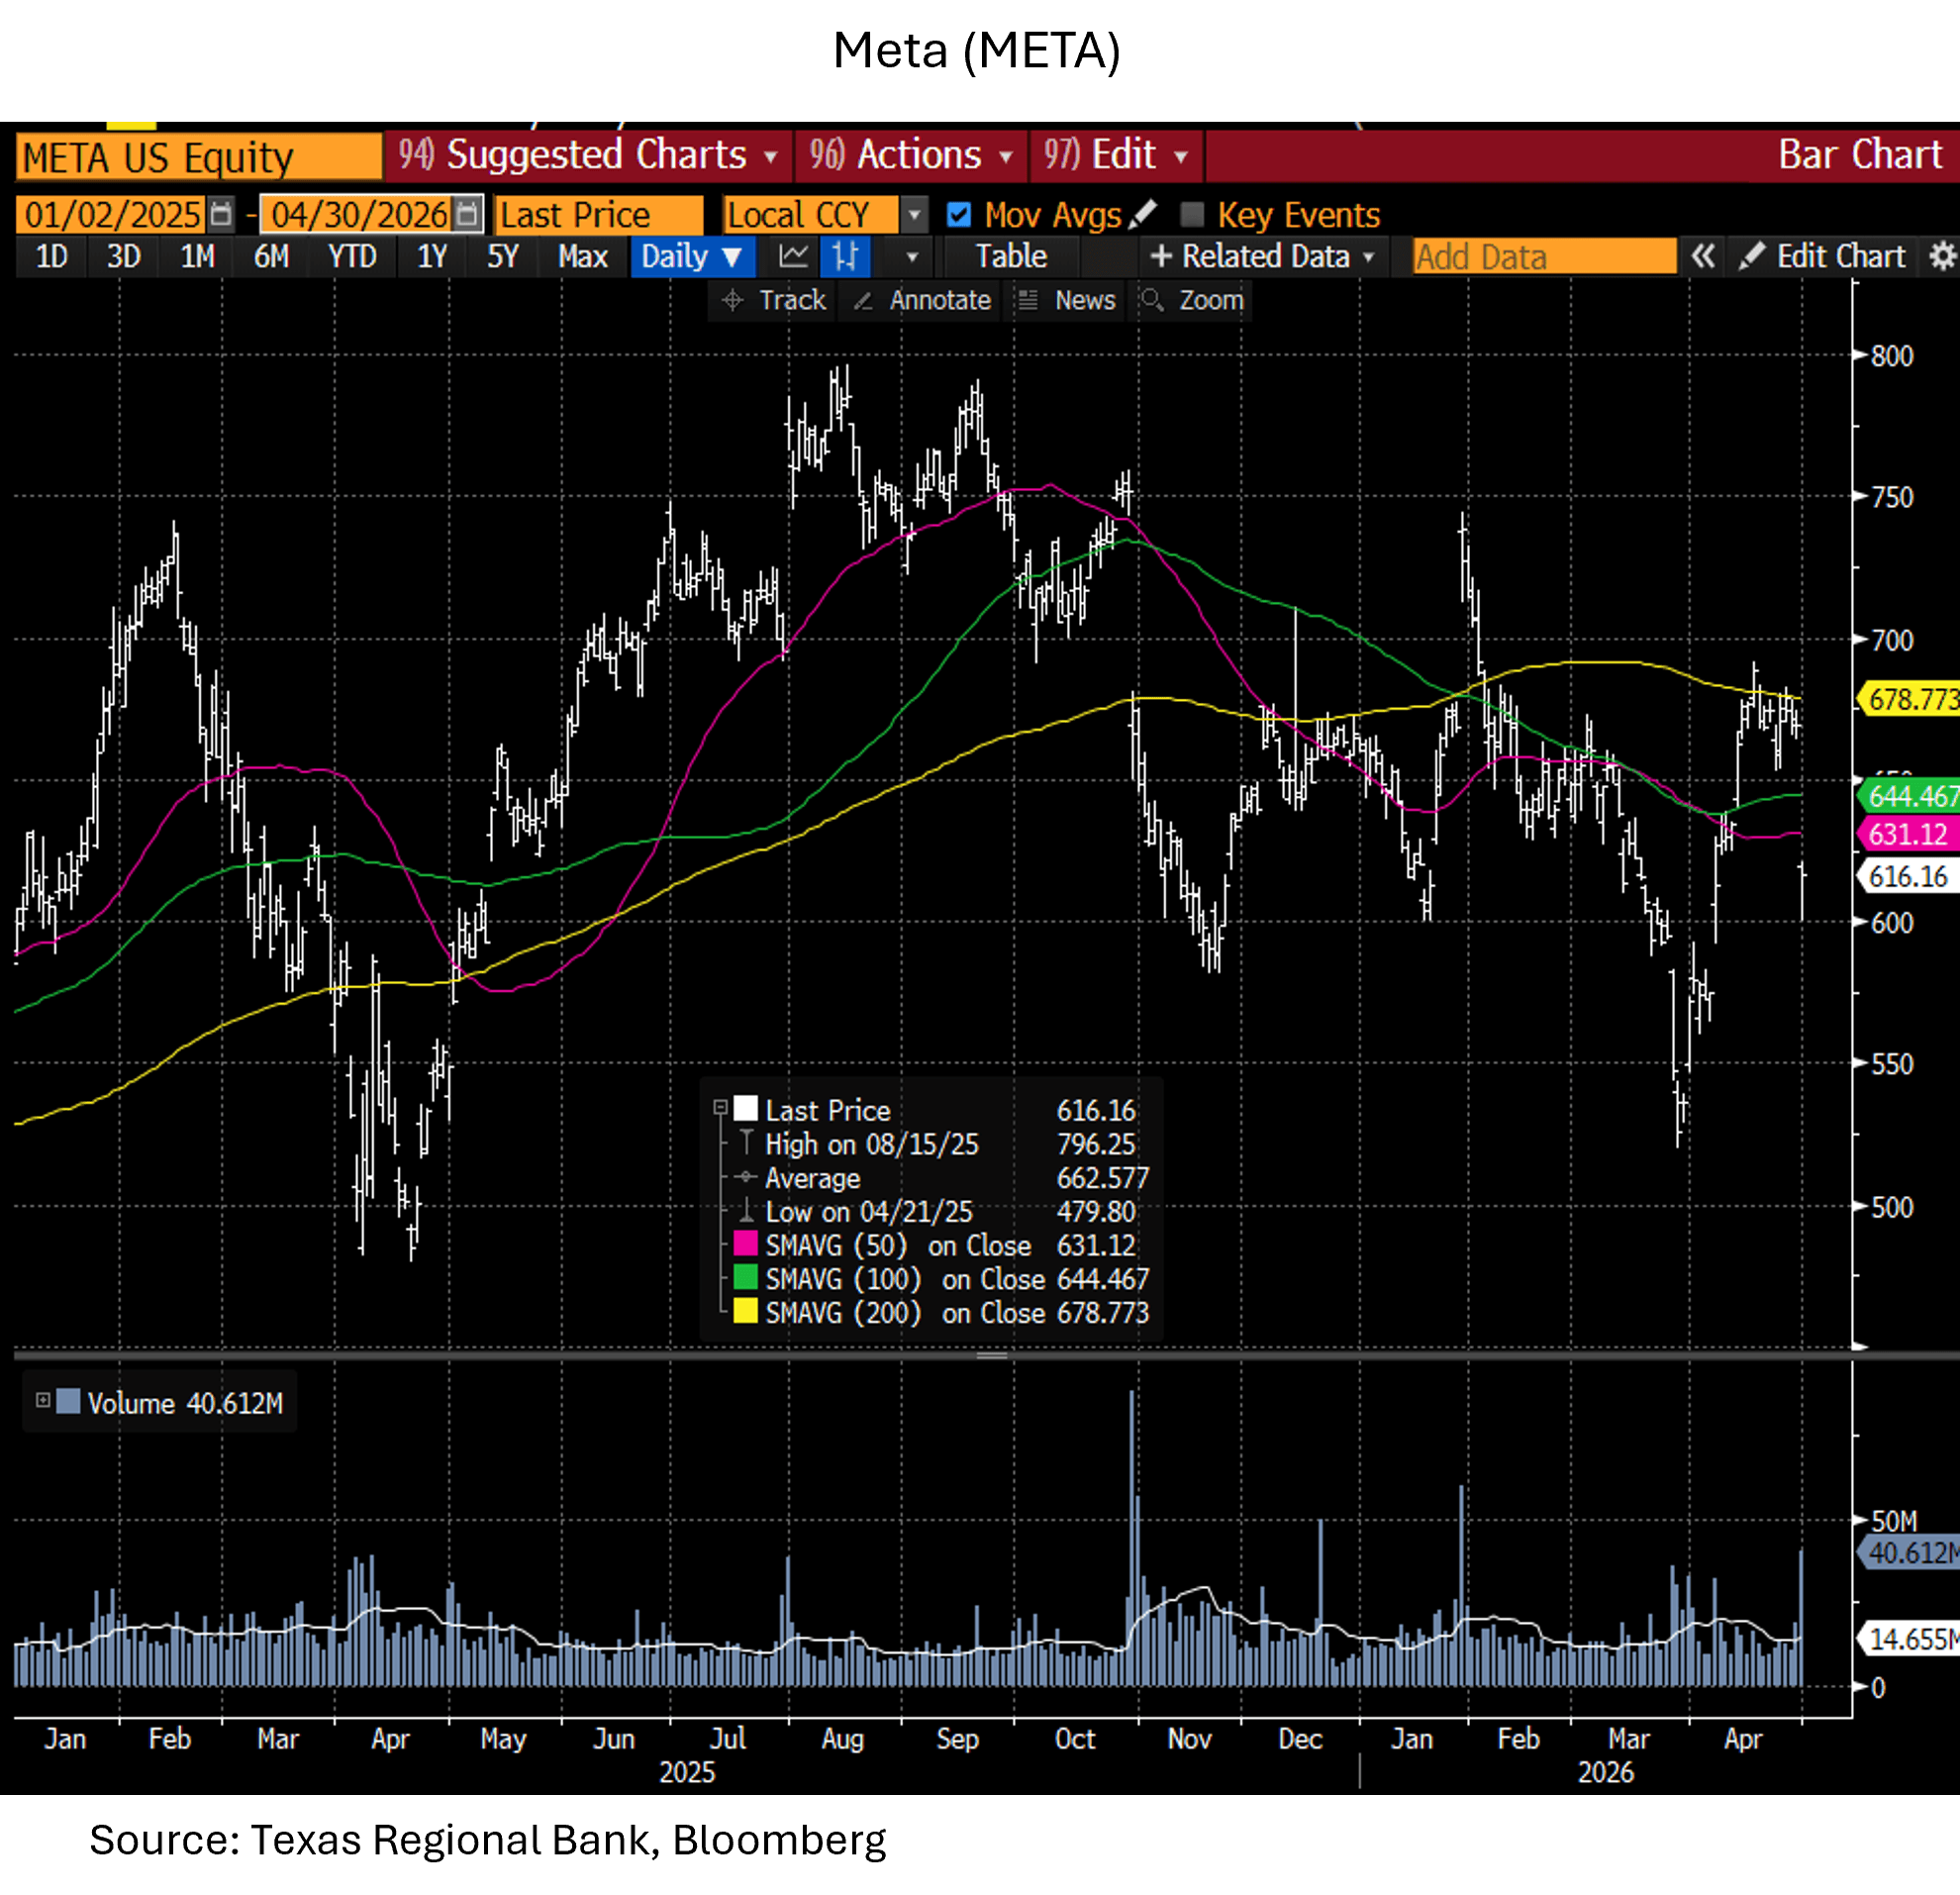
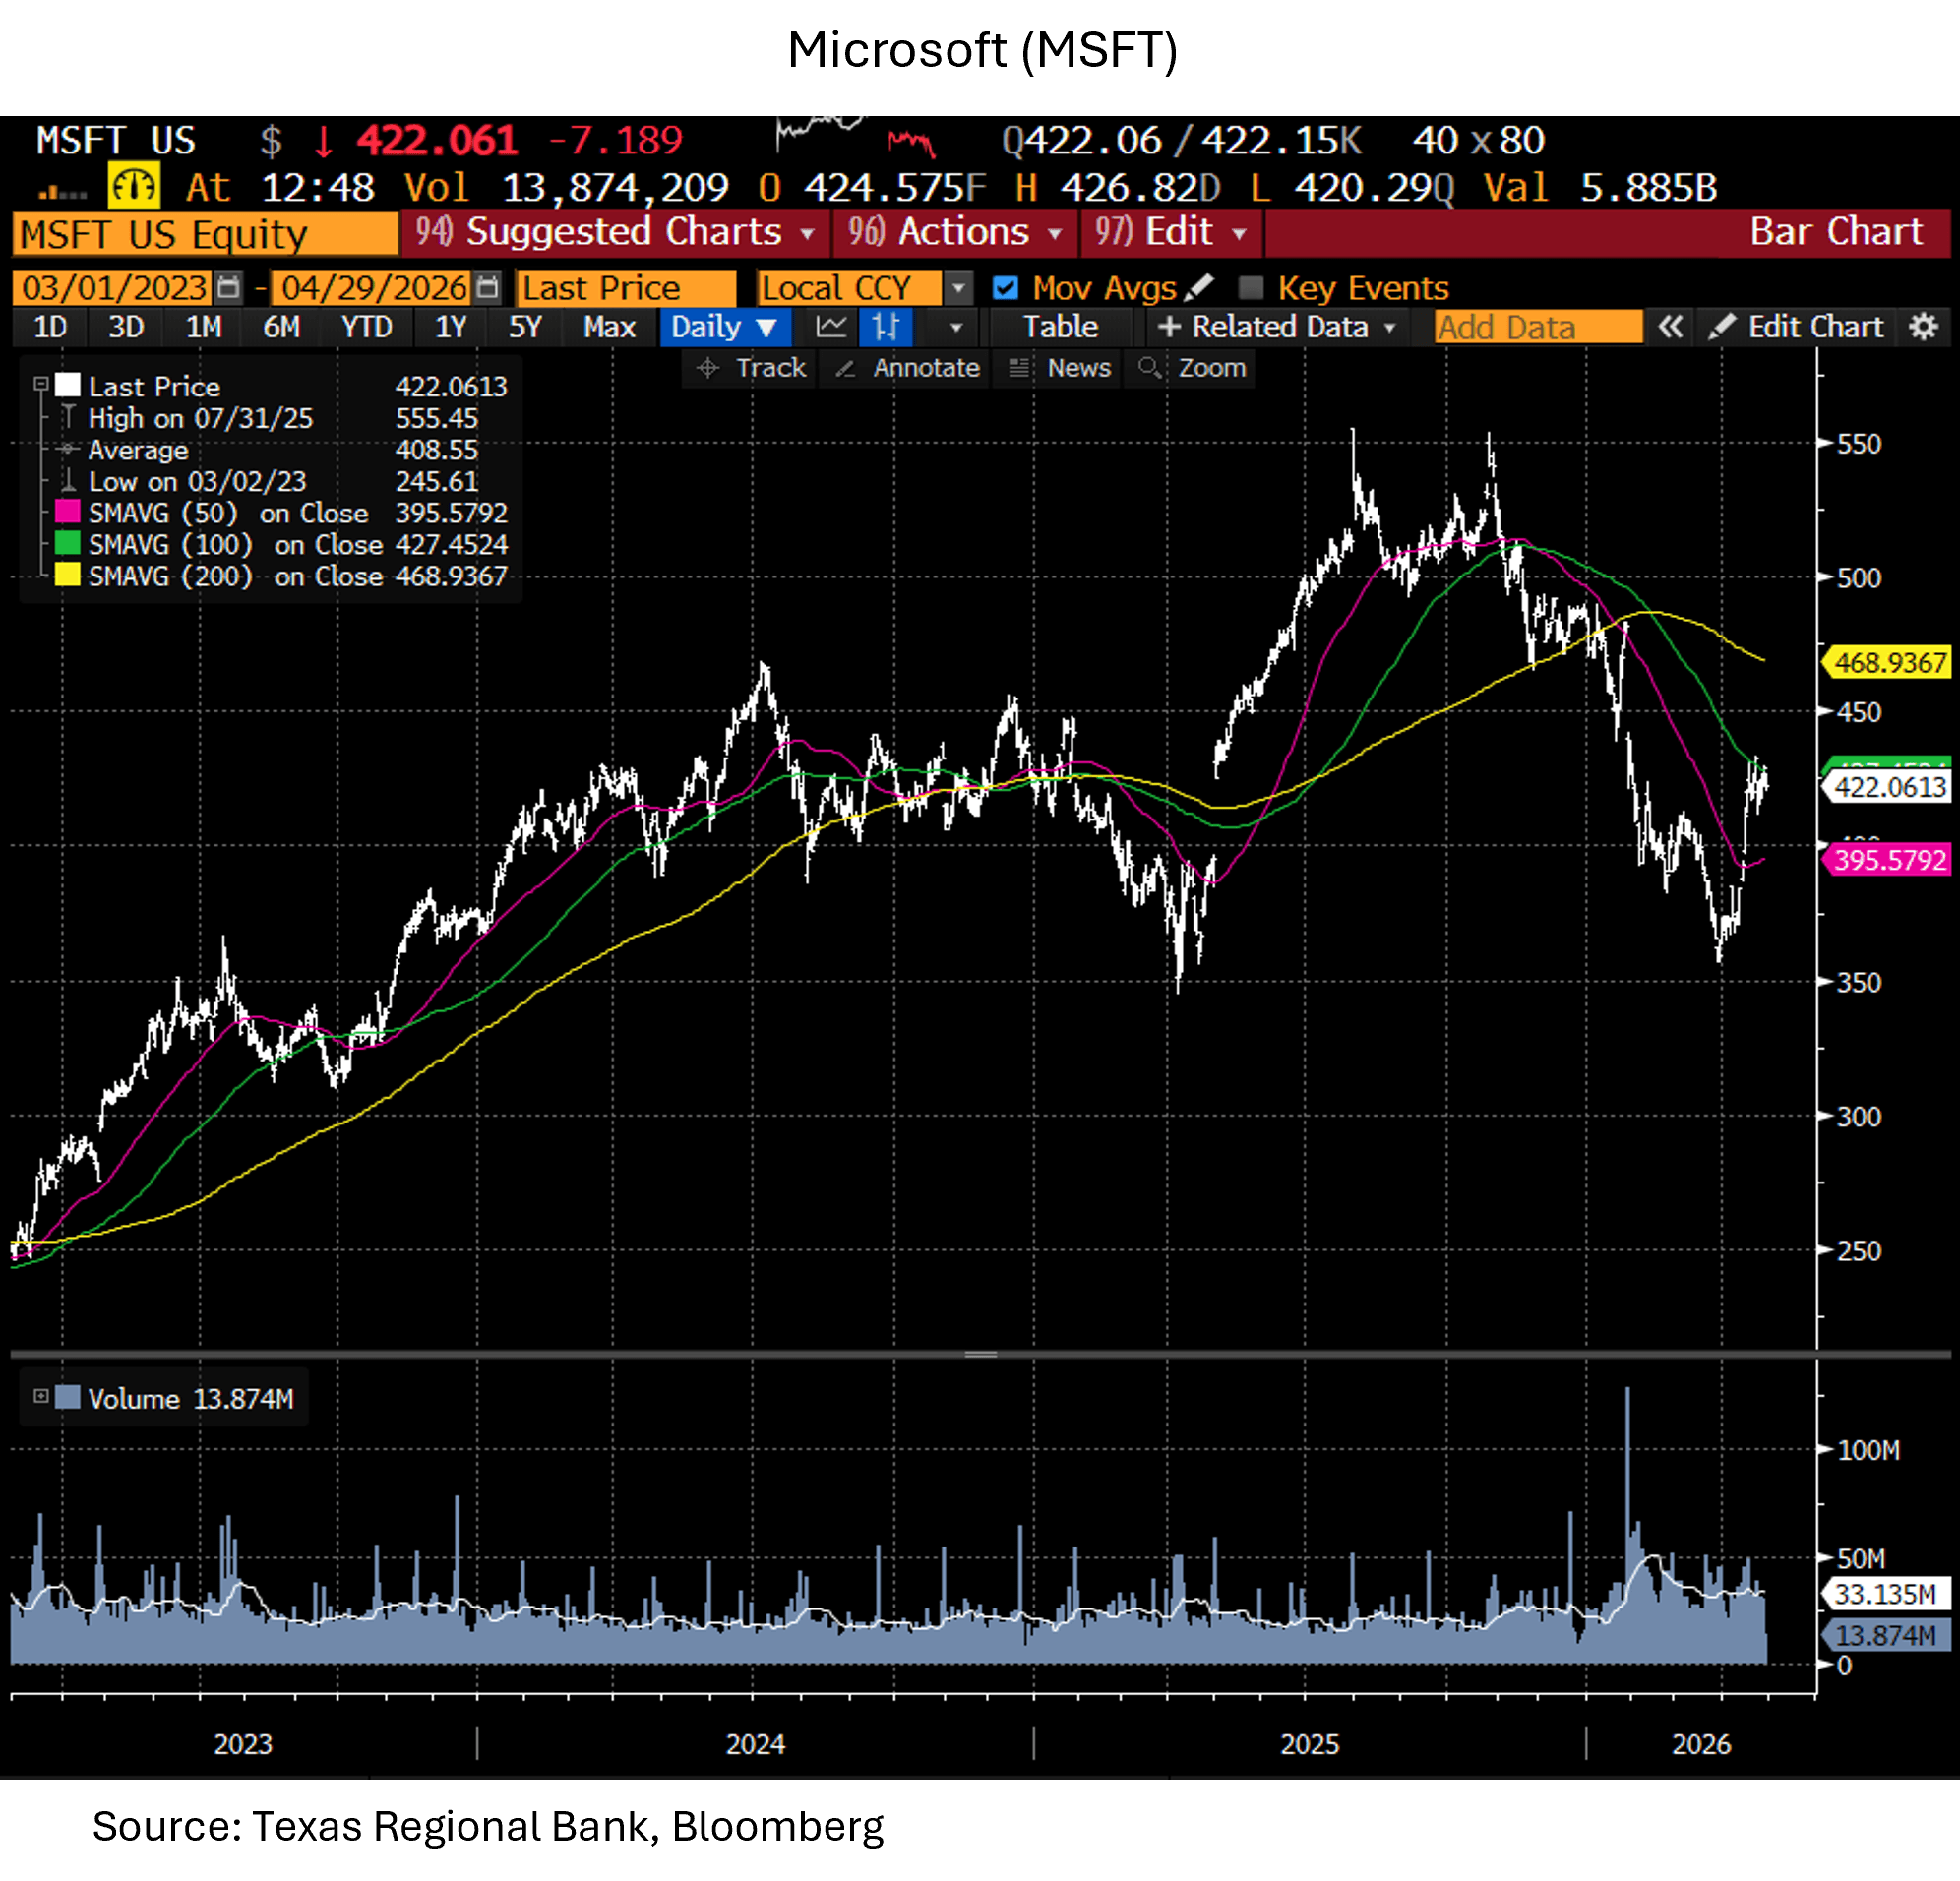
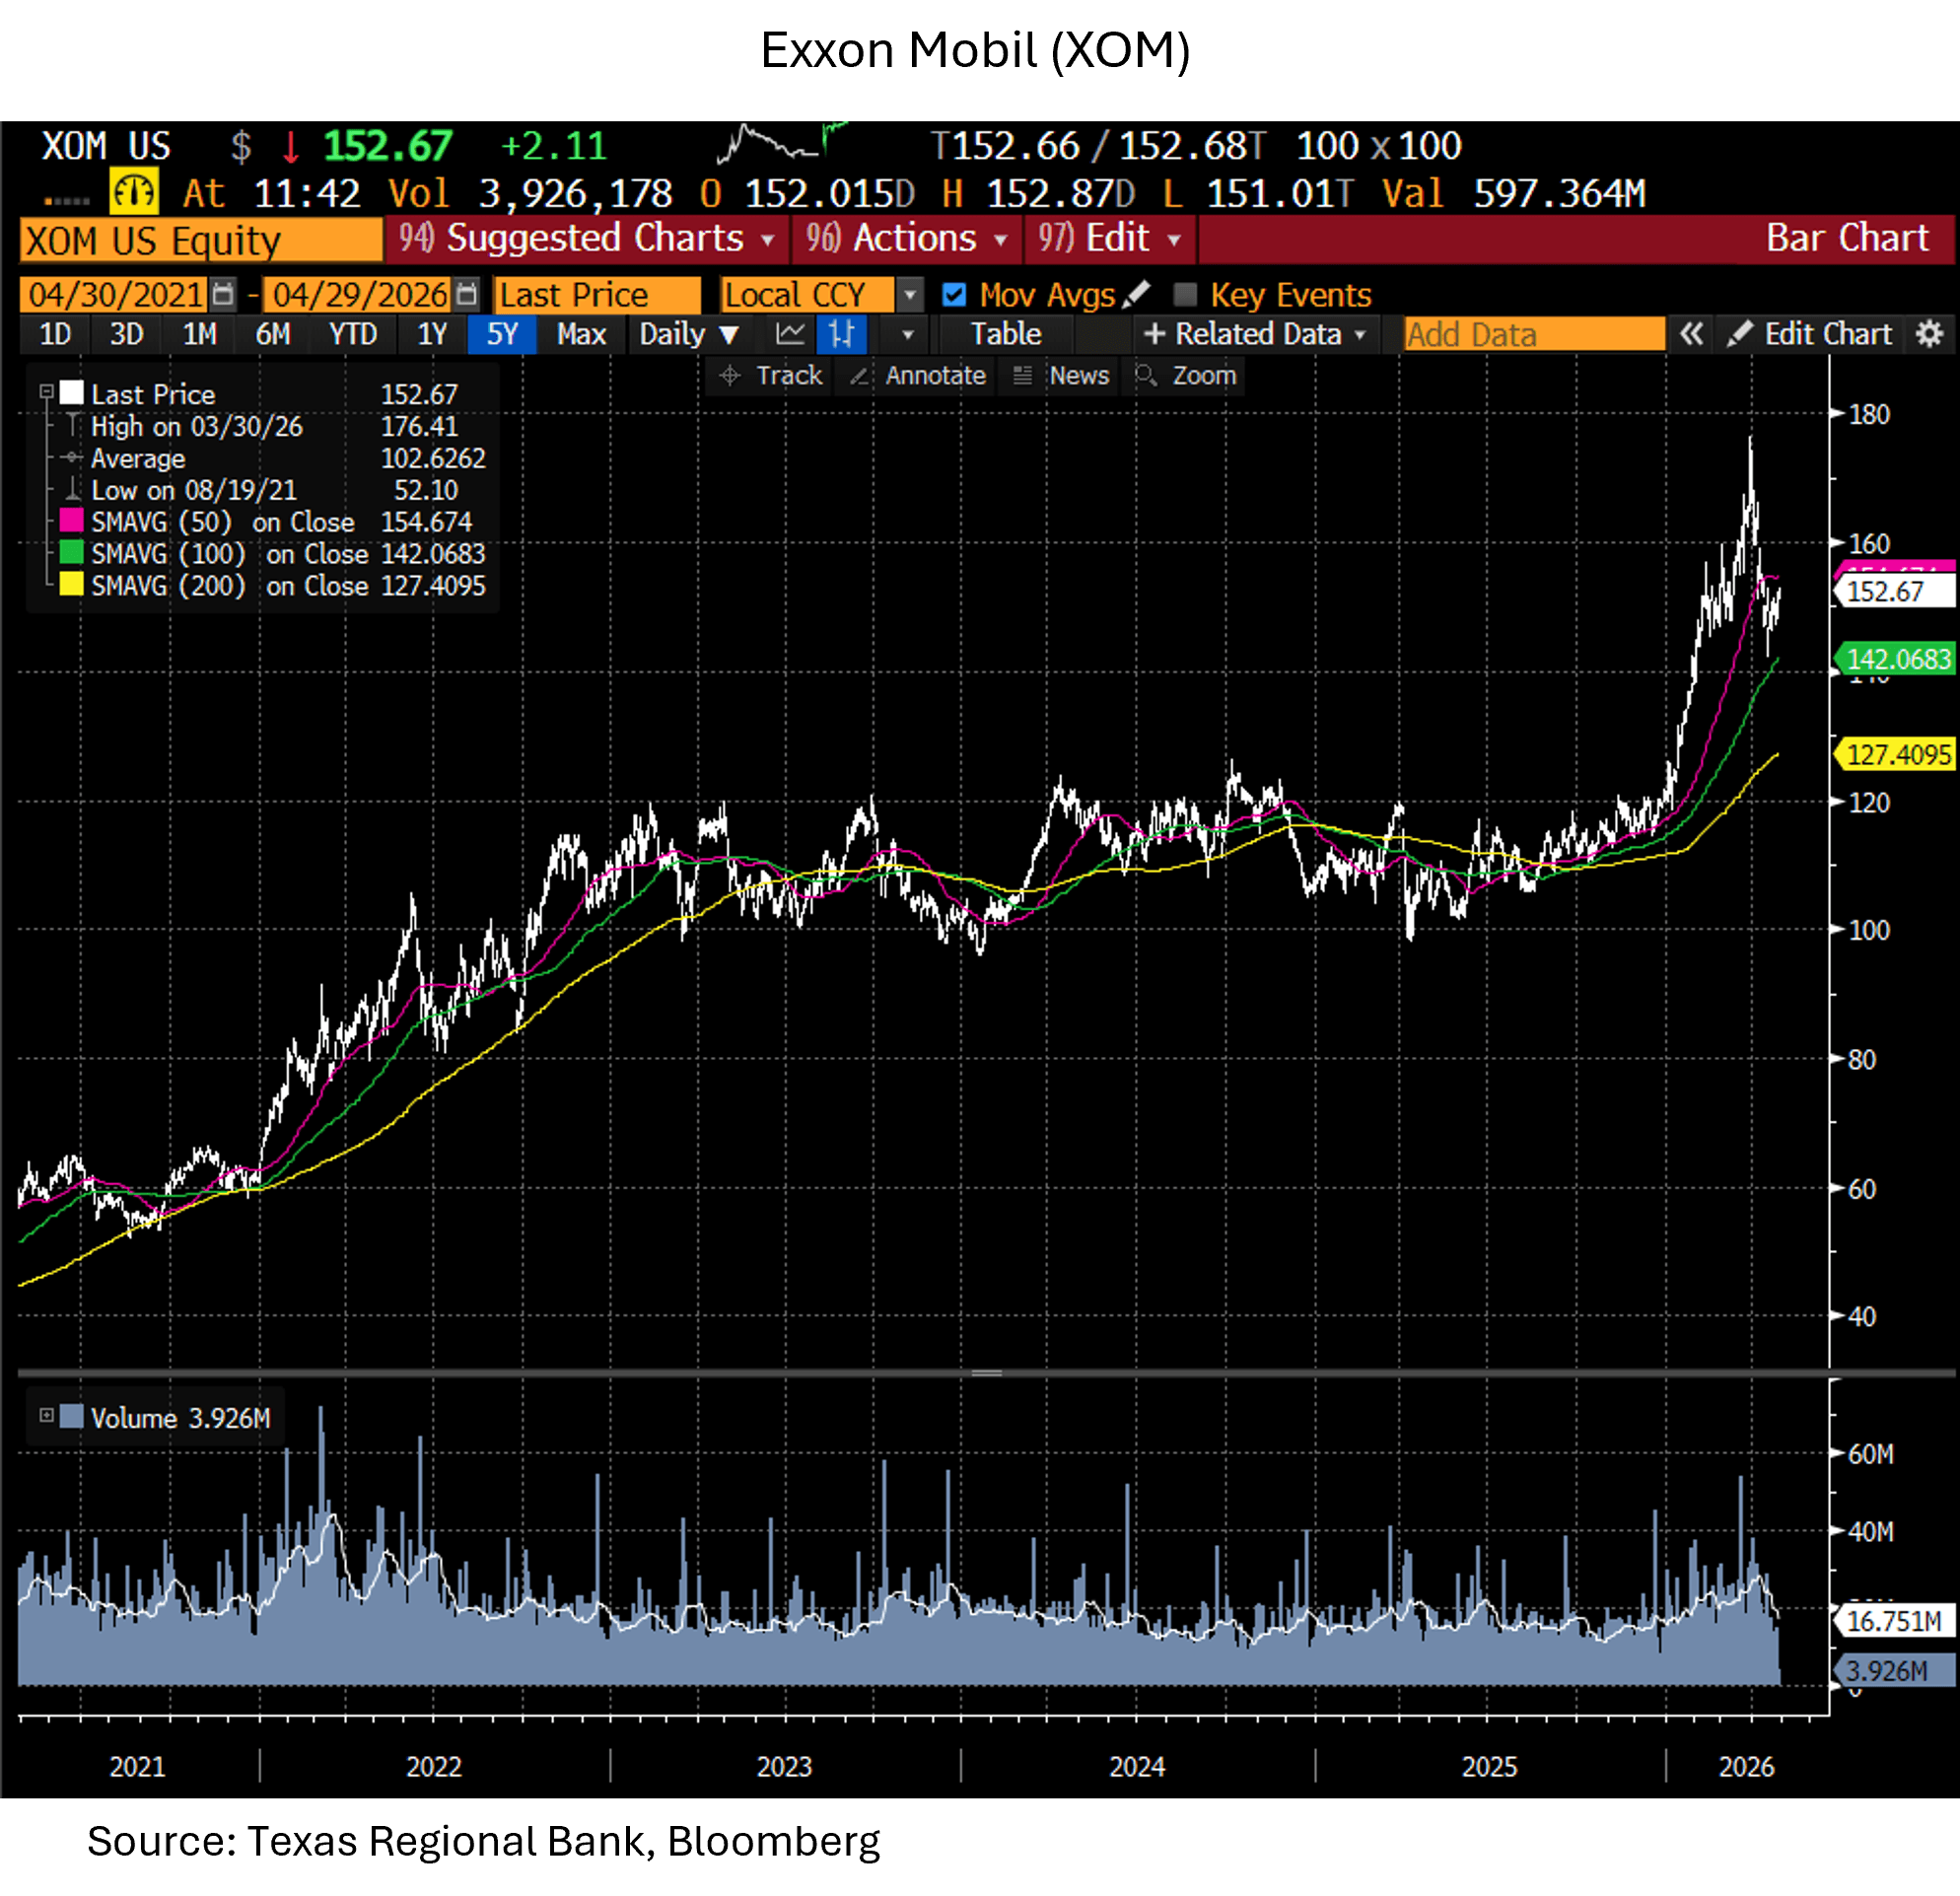
The impact on US equity indices has been surprisingly mild despite high day-to-day market volatility dictated by the war, the changing negotiating angles of the US President, militant propaganda from the regime and heartbreaking accounts from the streets of Iran. Amidst that strength, however, the leadership of the equity markets shifted, with concerns about technology companies like Microsoft and Meta (Facebook), and a significant tailwind for energy stocks benefiting from the rise in oil prices. For instance, XOM, after years bound within a range from $80 to $120, recently reached levels as high as $175, and the price of other oil producing majors and oil-service companies have traced similar paths. Meanwhile Microsoft and Meta, examples from the illustrious Magnificent 7 that have led equity performance for several years, traded from highs of $550 and $750 last fall, respectively, to lows of $350 and $600 in March and April.
In our year-end 2025 letter to investors, prior to the initiation of hostilities, we wrote “…Iran is one of the largest oil producers in the world, sits within missile range of several of the other largest producers in the world, and at least partially controls the Strait of Hormuz, through which a large volume of seaborne trade and a quarter of the world’s oil transits. US voters have become accustomed to quick, sanitized military solutions and this has the potential to devolve into something more complex.…”
Circumstances have certainly devolved toward complexity. How control of the strait resolves will have a lot to say about long-term oil prices and global economic results. It is possible that we end up with a result that leaves the Strait of Hormuz compromised and a bellicose Iran rebuilding, consolidating military strength and regional power, and continuing to wantonly murder its citizens. That scenario would point to a strained Middle East, continued aggression from Iranian proxy forces as well as naked aggression from Iran itself, and a significant risk premium in global commodities that require seaborne transport through the strait, particularly oil.
Negative scenarios are analytically attractive to Wall Street—sometimes it just sounds smarter to focus on the downside and, in this case, the downside seems more likely. But there is a more positive potential outcome. If Iran is sufficiently damaged such that true regime change becomes possible; if Iran is no longer a threat to its neighbors now and in the future, no longer a threat to the global world order or simply to crude oil production and transport in the region, the peace dividend would be significant and, alongside what has occurred in Venezuela, would include much lower oil prices and a positive economic tailwind for much of the world. While movie-script scenarios may be required for this outcome to occur, any odds attributed to the possibility of true regime change provide the possibility of an entirely different economic and market trend.
Yields, The Federal Reserve, and Inflation
It is an interesting time to follow the Federal Reserve, with a recently closed criminal investigation of the current Chairman and a race for his job, moderated by a US President in such fervent pursuit of rate cuts that markets began the year with serious concerns about Fed Independence. The President and Treasury Secretary Scott Bessent ultimately chose a strong candidate in Kevin Warsh, and, following confirmation, Warsh will steer the Fed in the unusual circumstance of having his predecessor, Jerome Powell, remain a voting member of the board when his term as chairman ends. The Iran war has intervened, and the market probabilities for rate cuts have dropped significantly as oil climbed above $100 and the economy has remained strong, and it will be very interesting to watch the new Chairman balance his relationship with the president with his own goals for change at the Fed, economic theory, the structure of the Federal Reserve board, and the possibility of war-driven inflation.
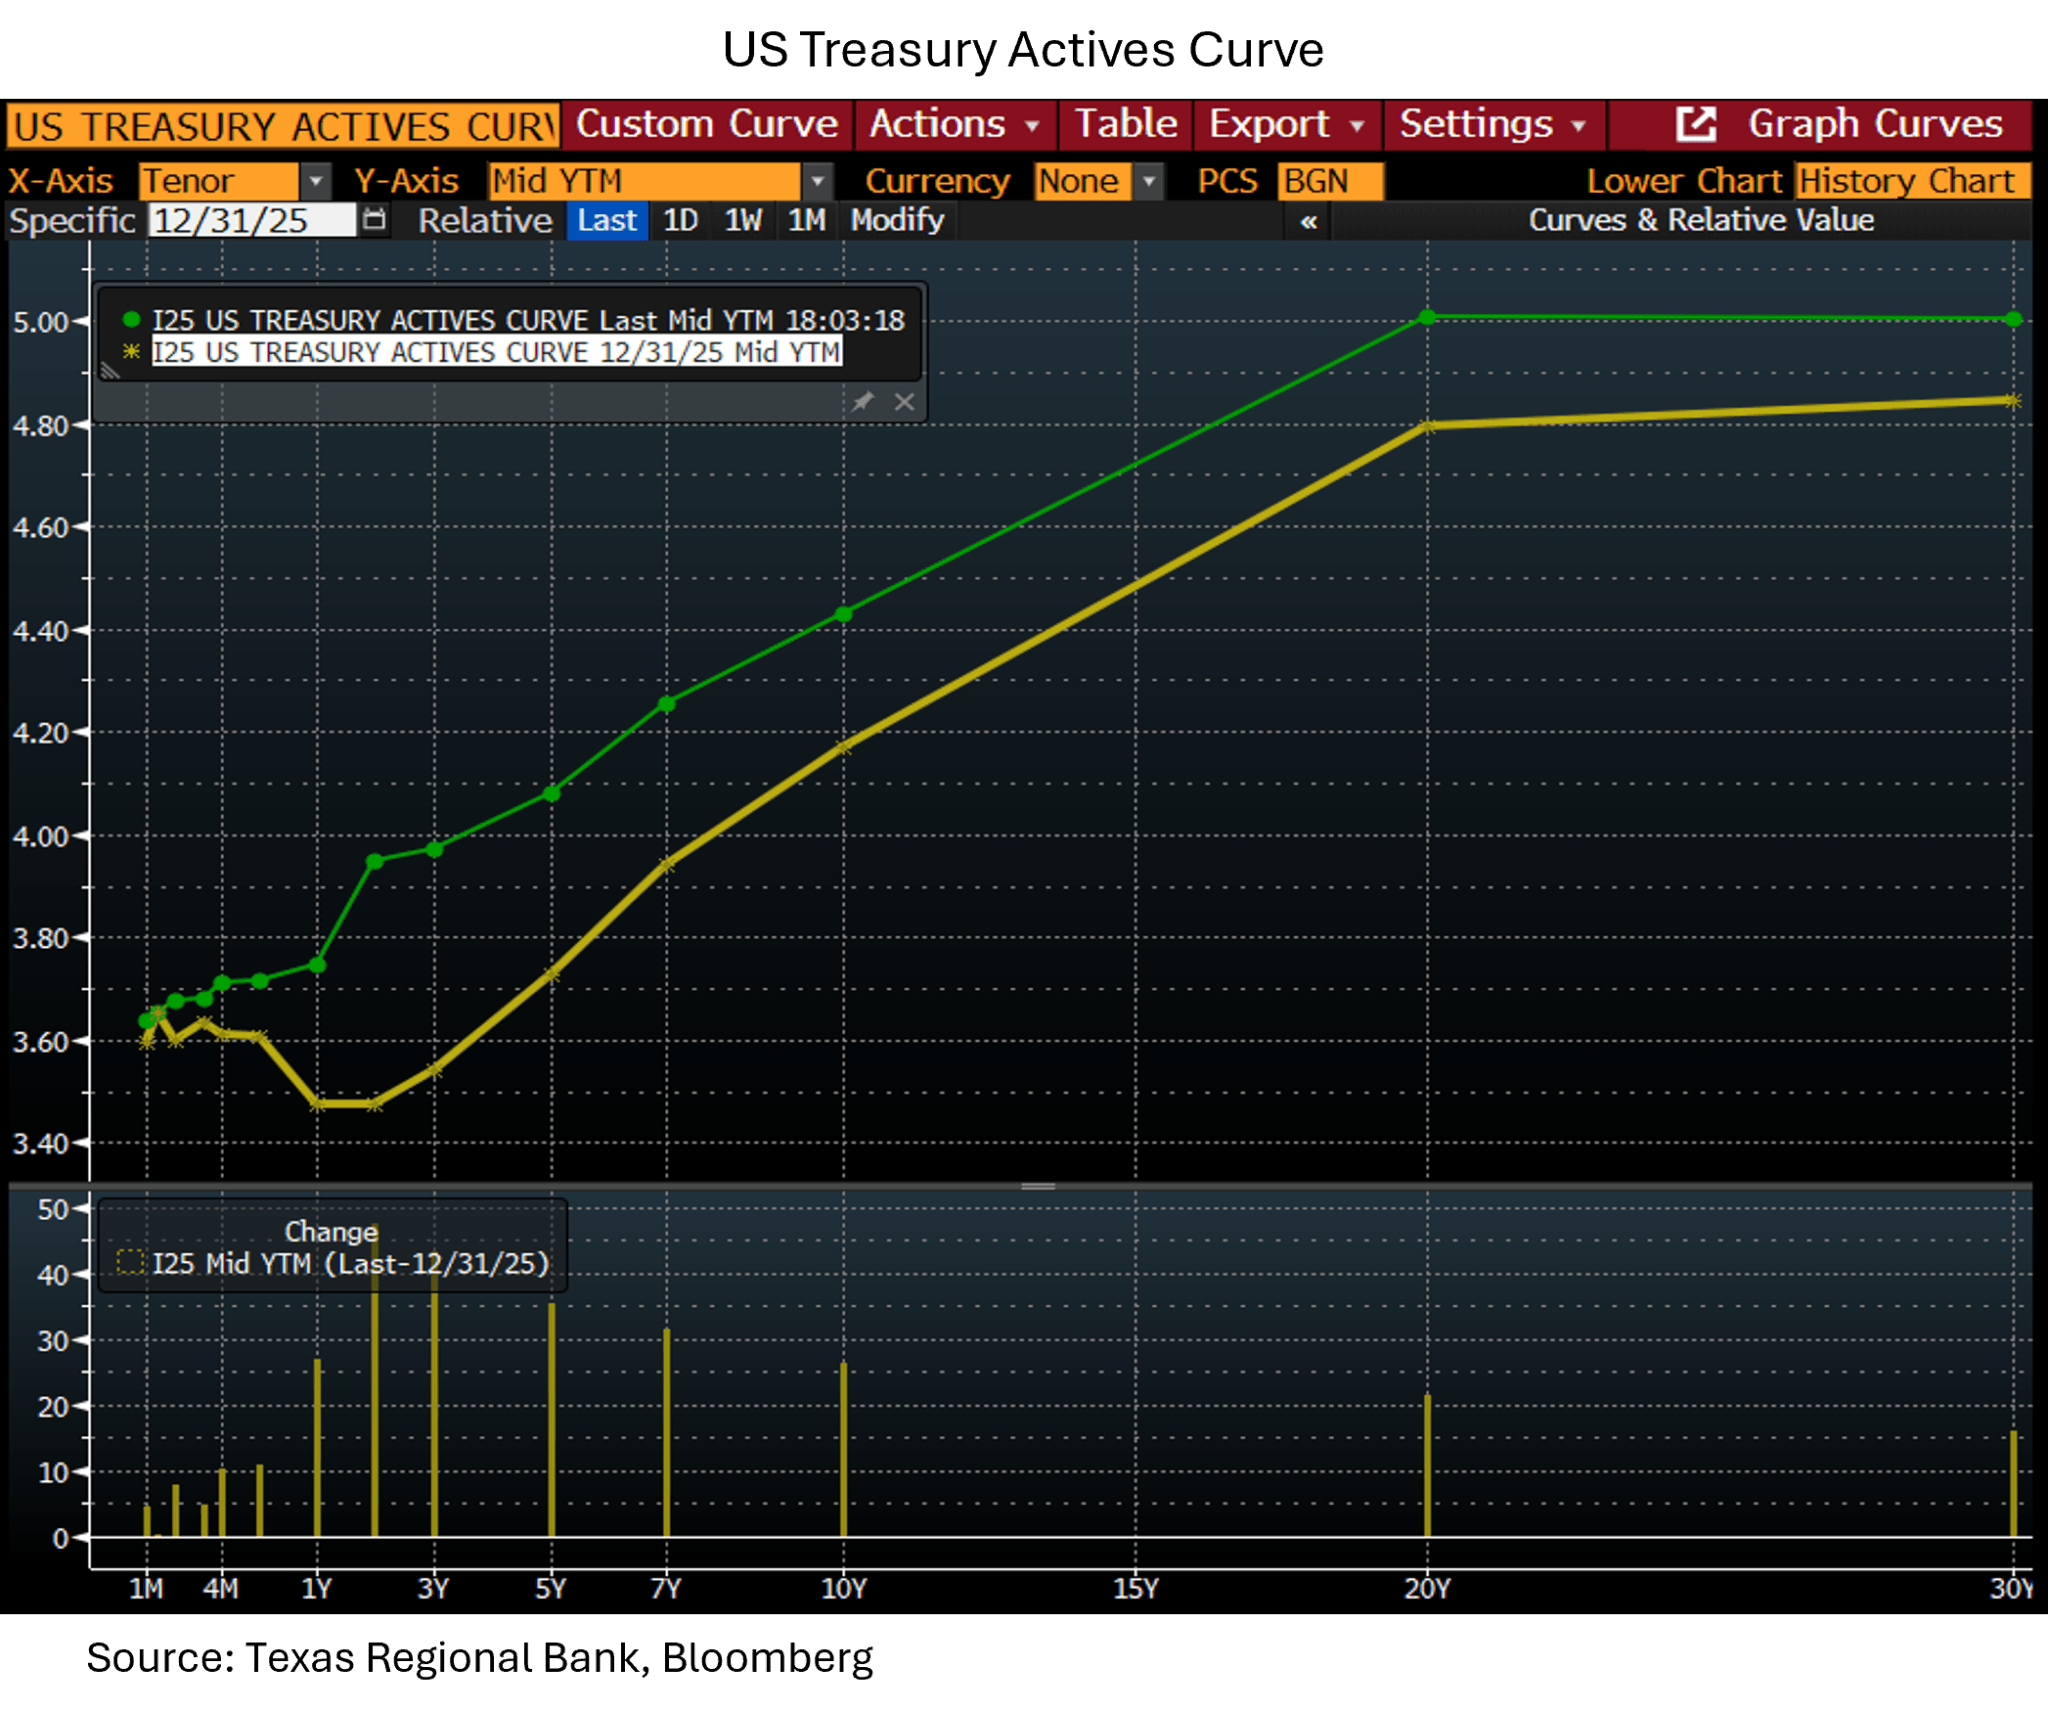
As the chart shows, the term structure of interest rates has adjusted along with these events, having started 2026 with 2-4 year yields lower than yields for 1 year and less, known as ‘inversion’ and often thought to be a precursor to recession (yellow line). Interest rates rose as the war gained momentum and the possibility of one or more rate cuts from the Federal Reserve diminished such that the yield curve became more normally shaped, with yields higher at the 2, 3, and 4 year mark than at shorter tenors (Green Line).
This change in term structure has created opportunities for government-oriented fixed income clients who often have investment policy approaches that restrict investments to fixed income approaches between 1 and 5 years duration. At the beginning of the year we gave such clients the difficult advice to keep powder dry and wait out a disadvantageous time for intermediate-term fixed income investment, but the abrupt change in term structure driven by the war has quickly provided the opportunity to deploy that capital at much better rates than what would have been available had we been impatient in January. It is common for investment advisors to allow potential opportunity cost to eliminate the possibility for constructive advice, but there are times when the best thing an investor can do is wait for a better pitch.
Market Valuation and Estimates
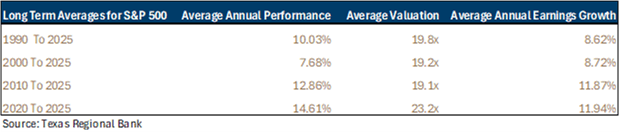
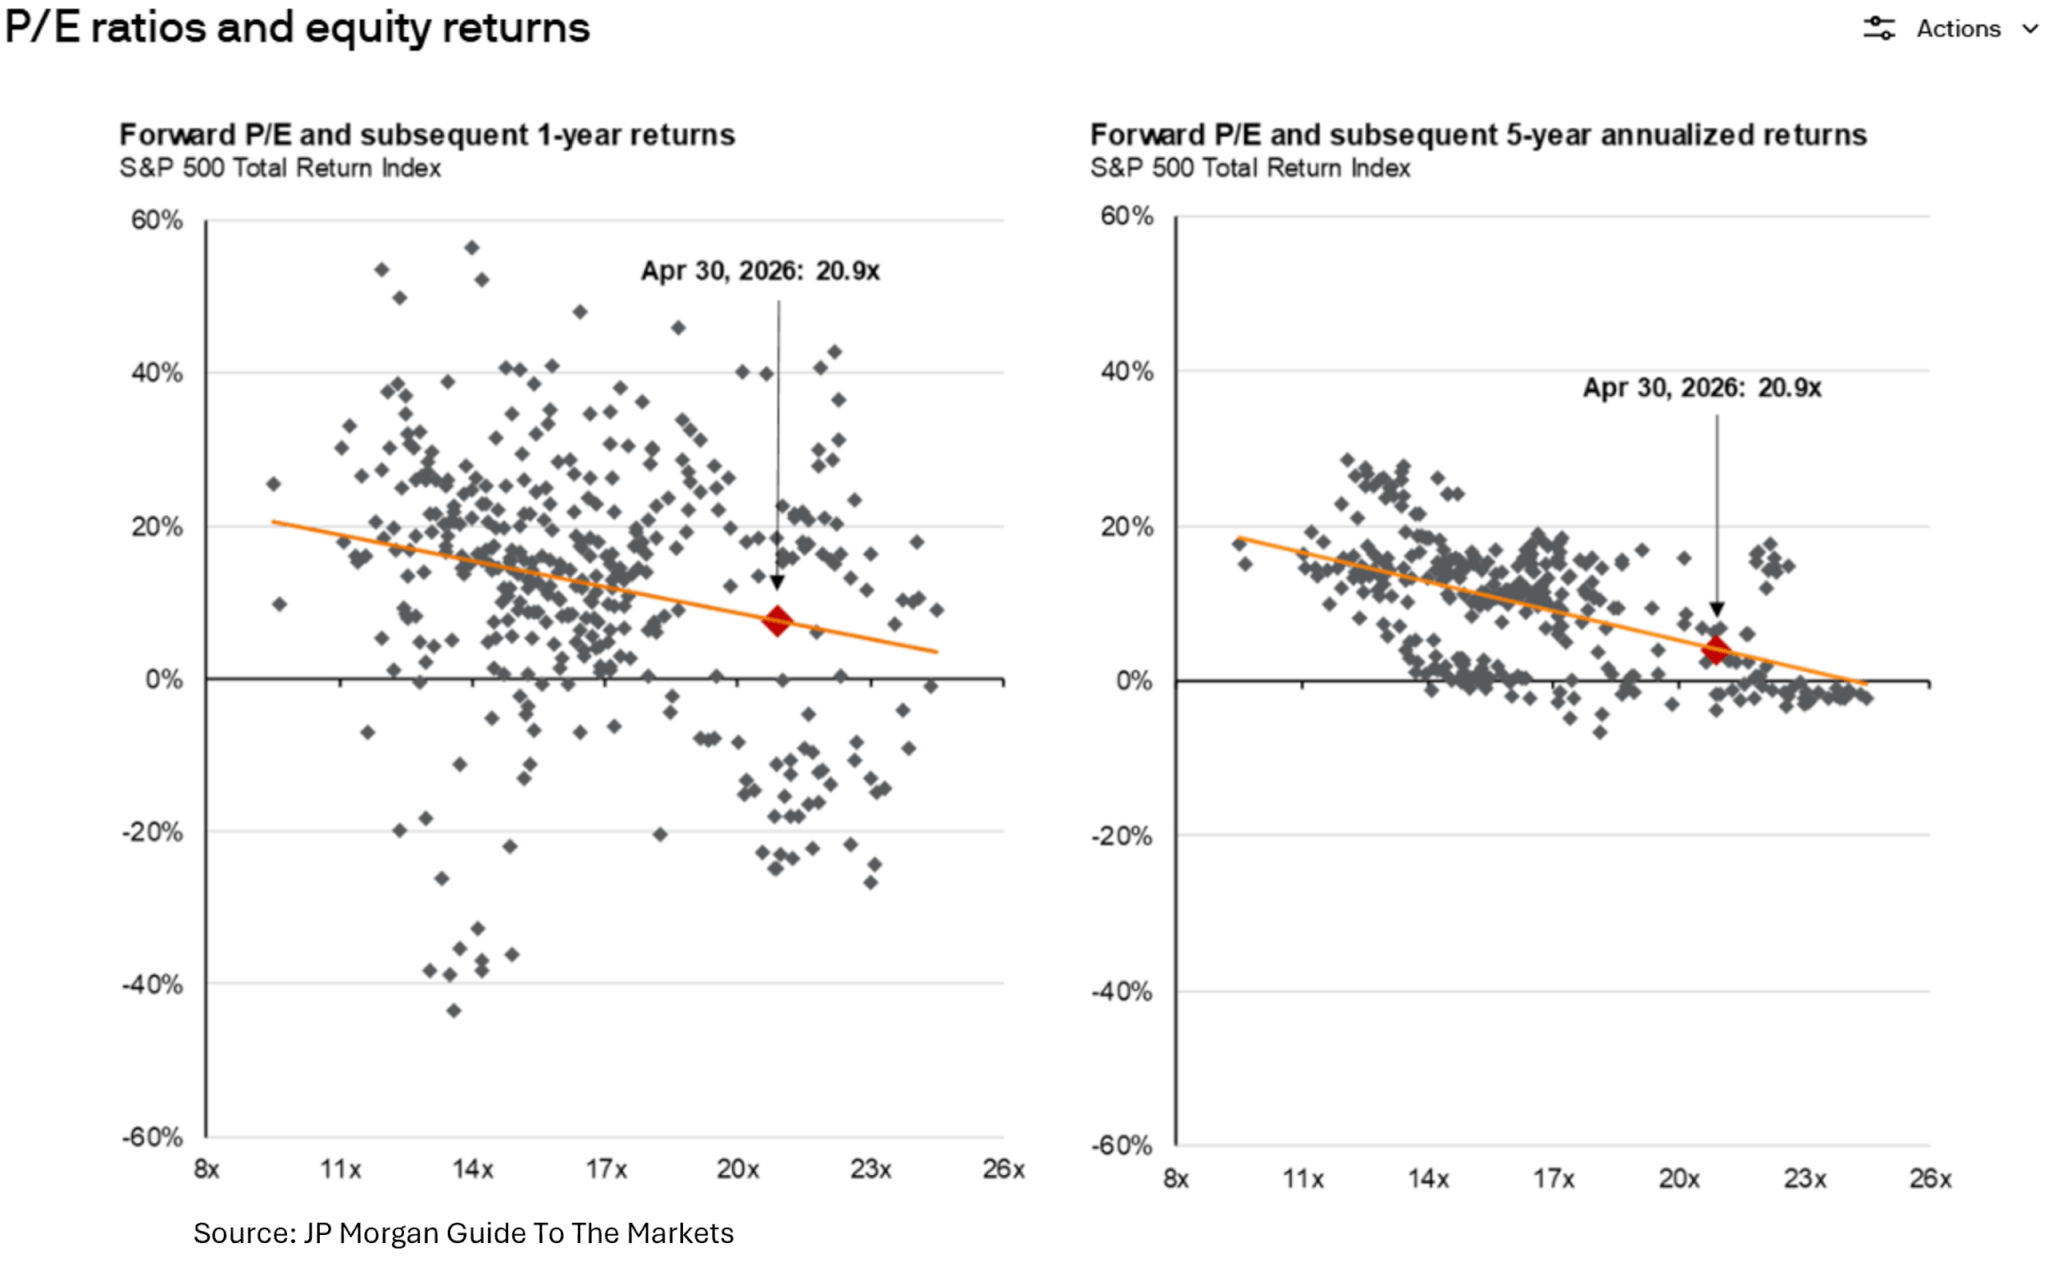
The S&P 500 has climbed a wall of worry through the end of April, despite the uncertainty created by the war in Iran. First quarter earnings results from energy companies and some technology companies have surprised to the upside, and the full year expected growth rate for S&P 500 earnings now sits at 20%, well above the average of 8.6% from 1990 through 2025, or even the 11.9% average for the 5 years ending in 2025. This level of earnings growth supports US equity markets, but still leaves equities expensive, with the S&P 500 trading at 26x trailing earnings and almost 22x estimated 2026 earnings through May 1. Growth rates will need to remain very high to sustain this level of equity markets valuation. The chart below demonstrates that while valuation can have minimal effect on equities over shorter periods, it heavily influences longer term return streams such as 5-year annualized returns.
Summary
While the war in Iran overshadows the daily news cycle and drives daily market volatility, equity market strength and the term structure of interest rates have been good for investors through the end of April. The composition of equity market gains is evolving, with strength from companies in the energy sector and more mixed results from the stocks that have provided leadership for the last several years, including the small group of ‘Magnificent 7’ stocks that have become very large weightings in the S&P 500. High valuation will represent a challenge to long-term returns, though exceptionally high rates of earnings growth have continued to support market gains.
Well-advised investors can position themselves to take advantage as volatility, in conjunction with long-term planning, provides opportunity. We recommend you have a discussion with your TRB Trust & Wealth Management team about portfolio positioning and the amount of risk in your portfolio relative to overall assets and borrowings, investment timeline and goals, as well as any opportunities to add to alternative investments or appropriate fixed income approaches that may provide income or returns that are less correlated with equity markets. We have a strong and growing team of Wealth, Trust, and Client Advisors throughout the state of Texas. Each of our teams is prepared to have a detailed conversation about your portfolio and the current balance of risks and opportunities.
DISCLOSURES:
Investment and insurance products: NOT FDIC INSURED | MAY LOSE VALUE | NO BANK GUARANTEE
TRB Wealth Management, LLC is a Registered Investment Advisor with the Securities and Exchange Commission
Form CRS | Form ADV | Advisor Info
TRB Wealth Management, LLC does business in the name of TRB Trust and Wealth Management. Trust and Family Office services offered exclusively through Texas Regional Bank. The trust department of Texas Regional Bank has engaged TRB Wealth Management, LLC to provide investment advice to Texas Regional Bank for trust department accounts.